By Mike Anderson, P.E.
In the October 2016 issue of “Asphalt” an article was published that discussed the integration of rheology into roofing applications. The article noted: “There is a logical path to integrating rheology into asphalt coatings, in a similar matter to the way performance-based specifications for paving asphalt have evolved.”
The problem (also noted in that article) is that although asphalt coating properties are critical, “there is limited agreement in the industry to what the rheological requirements would be beyond empirical softening point, penetration and the asphalt viscosity.”
Even though there may be limited agreement on what, specifically, the requirements should be, it is clear that rheological tools can help provide information on the expected behavior of asphalt roofing binders at a wide range of temperatures and loading frequencies.
If your friends jumped off a cliff
I suspect many of you have heard the start of this admonition – usually from a parent – and can finish it without even thinking. The more apt you were to follow the crowd, the more likely it was that you heard this at some point in your life. It could have been “cliff” or “bridge” or “roof” – which would be oddly appropriate for this article – but the sentiment was the same. Why do something just because everyone else is? Do we really need rheological testing of roofing asphalt binders when we’ve used the softening point and penetration tests successfully for so long?
I think the answer to the last question can be answered by understanding that times change and tools/skills change.
For conventional unmodified asphalt binders, the tools we’ve used for many years are still useful to this day. For paving grade asphalt binders, viscosity still matters at high temperatures. Penetration tells you something about intermediate temperature stiffness. What is different since the inception of the Strategic Highway Research Program (SHRP) is that the tools/skills we have now allow us to easily characterize asphalt binders at a wide range of temperatures and loading frequencies. For about the same amount of time required in testing, we can get more complete information.
I had a set of World Book encyclopedias when I was younger. They were my go-to resource for information for papers while I was in elementary and high school (I realize I’m dating myself here). As useful as they were to me then, I’d be willing to bet that my kids have never cracked open a bound encyclopedia; there isn’t that need with our access today to the internet. I still recall something Dr. David Anderson, one of the principal SHRP researchers responsible for the PG Asphalt Binder system, said to me once (paraphrasing here a bit): “The asphalt researchers many years ago weren’t stupid – they were really very smart. They just didn’t have the tools that we have today.”
To better understand the role the asphalt binder plays in the final performance of the roofing product – whether BUR or shingle coating – we need a complete characterization of the product. Rheological tests offer us that opportunity.
Replacing penetration and softening point
In the previous article, it was noted that the Asphalt Institute Roofing Technical Advisory Committee had discussed replacing the penetration test at 25°C with a test conducted on a dynamic shear rheometer (DSR) at the same temperature. A draft test procedure is being developed, but the expected conditions of the procedure are:
• DSR testing following equipment/specimen preparation described in ASTM D7175, “Standard Test Method for Determining the Complex Shear Modulus (G*) of Bituminous Mixtures Using Dynamic Shear Rheometer”
• 8-mm parallel plate geometry with 2-mm gap
• 1% applied shear strain
• 2.5 rad/s frequency
• 25°C test temperature
Previous work found that a range of penetration values from 12-25 dmm could be approximated by a range of G*2.5 values from 2.50-8.00 MPa. Similarly, the committee had also discussed using the temperature at which η* was equal to 1200 Pa-s, when measured at 1 rad/s using the DSR, as a substitute for the Ring & Ball (R&B) softening point temperature. As with the procedure for determining intermediate temperature stiffness, a draft test procedure is being developed, but the expected conditions of the procedure are:
• DSR testing following equipment/specimen preparation described in ASTM D7175, “Standard Test Method for Determining the Complex Shear Modulus (G*) of Bituminous Mixtures Using Dynamic Shear Rheometer”
• 25-mm parallel plate geometry with 1-mm gap
• 5% applied shear strain
• 1 rad/s frequency
• Three test temperatures: 90, 100, and 110°C (for coating or D312 Type IV asphalt binders)
Determination of the critical temperature to replace softening point can be accomplished by plotting complex viscosity, η*, as a function of temperature on a semilogarithmic graph and determining the temperature where η*1 is equal to 1200 Pa-s. Calculating the critical temperature by equation is probably even better than doing it graphically, as the relationship is approximated by a straight line over the small temperature range.
Temperature-frequency sweeps and mastercurve generation
Although the two DSR procedures described before can be performed independently, they still only constitute single-point measurements. Even more information can be obtained by taking the time to do temperature-frequency sweep testing so that more rheological information can be derived at a wider range of temperatures and loading frequencies. A reasonable range of loading frequencies is from 0.1 to 10 rad/s, spaced logarithmic at ten points per decade to yield a total of 21 loading frequencies per temperature. Test temperatures can cover any desired range subject to the DSR capabilities, but generally you want the spread to be no more than 10-15°C so that you can get sufficient overlap of the isotherms.
Once the temperature-frequency sweep testing is complete, you can shift the data to produce a mastercurve at a reference temperature. These curves show the response of complex shear modulus (G*) at a reference temperature as a function of loading frequency. As an example, Figure 1 illustrates the mastercurves for three roofing asphalt binders having approximately the same softening point temperature
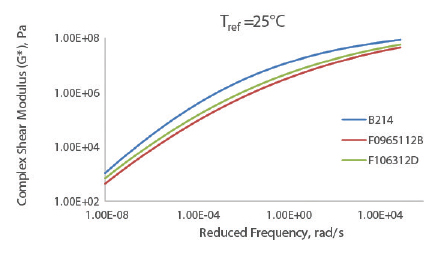
Figure 1: Mastercurve Data for Roofing Asphalt Binders with Approximately the Same Softening Point
From the general mastercurve data, G* and phase angle (δ) can be derived at a number of temperatures and loading frequencies. For example, Table 1 below shows the values of G* at 25°C and 2.5 rad/s derived from the mastercurves in Figure 1 and compares it with the measured penetration values for the same roofing asphalt binders.
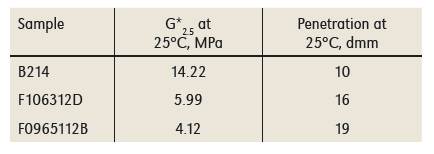
Table 1: Comparison of G* and Penetration for Roofing Asphalt Binders
In Table 1, two of the samples have G*2.5 values within the range of 2.50-8.00 MPa and likewise have penetration values within the range of 12-25 dmm. One sample (B214) had a value of G*2.5 that was higher than the range and had a penetration value that was lower than the other samples. In other words, the data makes sense as higher values of G*2.5 (greater stiffness) are related with lower penetration values. This is also illustrated in Figure 1, where the stiffest binder at 25°C is represented by the curve that is highest on the graph.
Table 2 shows the calculated temperature (using mastercurve data) at which the complex viscosity at 1 rad/s (η*1) is equal to 1200 Pascal-seconds.
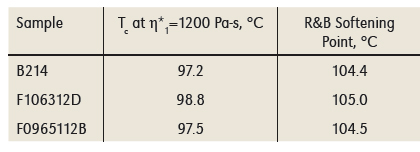
Table 2: Comparison of Critical Temperature
Although the values are slightly different for Tc than softening point, they are in the right order and of similar magnitude, giving confidence that the rheological parameter and softening point provide similar information.
Would you jump, too?
So all the cool kids are doing rheological testing, talking G* out in the courtyard and δ under the bleachers. Should you join them? Other than the fact that you can get a broad range of information from DSR testing, why bother? I’d ask you to also consider time and precision.
Testing time to conduct a penetration test from the point where you pour the sample until you get a result is approximately 2.5 hours. If you just perform a single point measurement on the DSR at the same temperature (25°C) the time required from the point where you pour the sample until you get a result is approximately 20-30 minutes. Even though the softening point test is quicker than the penetration test (about half the time), it still would take at least as much, if not more, time as the temperature sweep procedure to determine the critical temperature.
The precision of the DSR tests are also comparable to the penetration and softening point tests. Recent comparisons conducted as part of the Asphalt Institute’s “Roofing Proficiency Sample Program” show that the coefficient of variation (1s%) was 1.4 percent for the critical temperature from the DSR and 1.7 percent for the softening point test. For the same studies, the coefficient of variation was 15.4 percent for the G*2.5 from the DSR and 14.4 percent for the penetration test.
Considering that the asphalt technologist can use DSR tests to get more information in a comparable, or even shorter, time with similar precision, I think I’d have to say “Yes, Mom, I’d jump too.”
Anderson is the Director of Research and Laboratory Services for the Asphalt Institute.