


Over 50 years ago, the Asphalt Institute introduced full-depth asphalt. These full-depth pavement structures were thick (often 10-20 inches on high volume roadways) and were built directly on the subgrade as opposed to modern layered pavement design that typically includes granular base.
Pavement distresses such as fatigue cracking and potholes were nearly non-existent on these deep strength pavements. However, it quickly became apparent that thermal cracking was an issue, especially on non-granular soils in extreme climates.
In those days, pavement maintenance activities such as crack-sealing and surface treatments were not well utilized and the unmaintained cracking became a rehabilitative headache impacting maintenance costs and ride quality. The difficulty in maintaining thermal cracks in cold northern climates and increasing material costs resulted in a return to granular base layers and pavement sections that were not as thick but still performed very well.
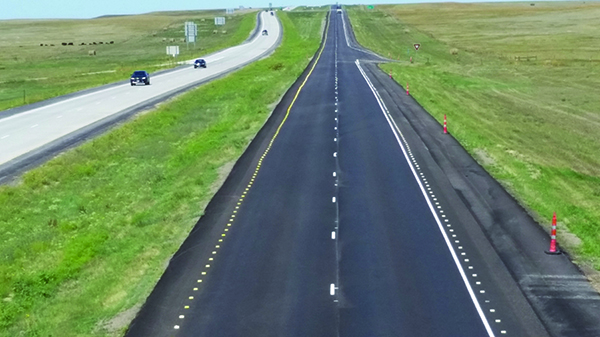
Two pavements in South Dakota
A 20-mile corridor of rural interstate was originally constructed around 1973 or 1974 in western South Dakota.
The westbound lanes were the original U.S. Hwy 16 alignment that carried existing traffic before 1973 while the new set of eastbound lanes were graded and paved with eight inches of continuously reinforced concrete pavement. Upon completion, the existing asphalt lanes were reconstructed using a section consisting of 12” of granular base and 12.5” of asphalt pavement. All of the flexible pavement sections were paved with an unmodified penetration graded asphalt binder.
In 1990, at the age of 16 years, the asphalt pavement underwent a 1” hot in-place recycling treatment to correct significant thermal cracking. In 2002, at the age of 28 years, the asphalt section was milled and received a 3” overlay, consisting of a 1.5” lift of dense graded leveling mix and a 1.5” surface lift of modified SMA. In 2016, at the age of 42 years, the section was overlaid with an additional 1.25” thick SMA, at a cost of $294K per 2-lane mile. It was paved in less than 2 months with single-lane closures. The long-range plan in the DOT pavement management system estimates the next rehabilitation of the asphalt set of lanes will occur in 2030 at the ripe old age of 56 years.
The PCC was removed and replaced in 2013 and 2014. The projects were closed to traffic for two construction seasons. The traffic was diverted during construction onto the adjacent set of asphalt lanes at a project cost of $1.645 M per two-lane mile.
The asphalt pavement continues to provide exceptional service as it nears its next rehabilitation in 2030. Its original bottom is paying huge dividends to the taxpayers of South Dakota. Moreover, the 144 perpetual pavement awards issued by the Asphalt Pavement Alliance document the long-term value of asphalt pavements.
Using PMA on heavily-trafficked Minnesota routes
So, what about more modern, heavily traveled routes using polymer-modified PG graded binders?
In 2015, the Minnesota DOT (MnDOT) reported on several asphalt pavements in the Minneapolis/St. Paul metro area that were experiencing excellent performance. This was significant in that MnDOT had a moratorium on asphalt pavements for all routes in the Metro area with over 10M ESALS. The excellent performance of polymer modified Superpave mixtures led to the lifting of the asphalt moratorium on high volume routes. This subject was covered in the February 2017 issue of “Asphalt.”
The oldest project highlighted in the 2017 article was U.S. Highway 10 in Anoka County. This project is a major freeway in the northern part of the metro area. The project was constructed in 1998 and carries over 90,000 vehicles per day, including 4,500 trucks and continues to exceed design expectations.
The pavement section consisted of a four-foot sub-cut with a granular backfill topped with six inches of aggregate base and nine inches of Superpave mix. The first five inches of pavement was a 19.0mm NMAS mixture that contained 15 percent RAP and PG 58-28 binder. The intermediate lift was a 2.5-inch layer of 12.5mm mix containing no RAP and PG 58-34. The wearing course consisted of a 1.5-inch layer of 9.5mm mixture containing no RAP and PG 58-34 binder.
MnDOT policy is to rehabilitate roadways when the Ride Quality Index (RQI) reaches a value of 2.5. The MnDOT pavement design manual uses a time to first overlay (RQI = 2.5) of 20 years for the LCCA rehabilitation schedule. The RQI value for U.S. 10, in 2015, was 3.6 with a forecast for the pavement to reach a 2.5 RQI in 2030. Updated pavement condition data obtained in 2020 shows an RQI of 3.5, with a forecast for the pavement to reach a 2.5 RQI in 2032.
Built in 1998, with a projected time to first overlay in 2032, means that this asphalt surface is expected to last for 34 years. That’s performance that can’t be ignored.
The future
The vast amount of research conducted over the last 20 years has been dedicated to increasing the durability of asphalt mixtures. So, what has changed? Our pavements today may contain increased quantities of RAP, RAS, recycling agents, rejuvenators, WMA additives, fibers, ground tire rubber or other recycled products. In addition, refinery crude slates and the resulting binders have changed. None of the variables mentioned above were considered when the Superpave PG binder grades were developed over 25 years ago.
So, what is a designer to do? Three words – balanced mix design.
Balanced mix design
In the past, it was easy to design a pavement that would not rut by using hard asphalt in a dry mix, but it would crack and ravel. Conversely, using a lot of soft asphalt would result in a pavement that would never crack, but would rut and flush. The optimum design was somewhere in between these two extremes.
The Marshall Stability and Flow tests attempted to balance these opposing forces but often failed to definitively relate to future performance on the roadway. Even though these procedures did not reliably relate to performance, a pavement designer using the traditional materials available could be relatively assured that, given sufficient thickness, the pavement surface would perform in an acceptable fashion for a reasonable period of time.
Today, balanced mix design (BMD) testing offers a more powerful set of tools to determine mixture performance. The Asphalt Pavement Analyzer (APA) and the Hamburg Wheel Tracking (HWT) device have been deployed for many years. With experience, both methods will provide results that minimize plastic deformation in the field. Tests to determine cracking potential are not so well defined.
Many of the procedures are still in some stage of research or deployment. Laboratory aging of mixtures is one of the major stumbling blocks yet to be universally refined and can significantly impact the value of the results. Continuing research will determine the highest flyers in the crack-testing universe. How we implement those rutting and cracking tests will determine if our pavement performance improves or remains stagnant.
Implementation
Regardless of the specific rutting and cracking tests and procedures utilized, they all will give an engineer the two basic curves – a rutting curve and a cracking curve.
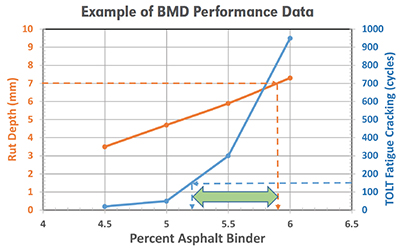
The crack resistance curve for the example above is Texas Overlay Test data with the number of cycles to failure on the right vertical axis. The orange line is APA rut test data in millimeters shown on the vertical axis on the left. Typical balanced mix design test results will determine a minimum asphalt content to meet a crack resistance threshold and a maximum asphalt content that corresponds to a maximum allowable rut depth. The range of acceptable binder content for this example becomes 5.2 to 5.9 percent. The question then becomes “which binder content is selected?”
The fact that projects are awarded to the lowest acceptable bid requires a contractor to select a 5.2 percent mix, as that would be the most economical, but is that the best value for maximizing pavement life? Further analysis of the example shown indicates the following:
| Binder content | Crack Resistance | Rut Depth |
| 5.2 | 150 cycles | 5.2 |
| 5.9 | 825 cycles | 6.8 |
Increasing the virgin binder content by 0.7 percent would result in a crack resistance increase of ≈ 450%, at the risk of increasing rutting approximately 30 percent. As one can see, selecting the asphalt content to maximize a benefit/cost ratio may become difficult. The key will be establishing appropriate thresholds when implementing BMD specifications.
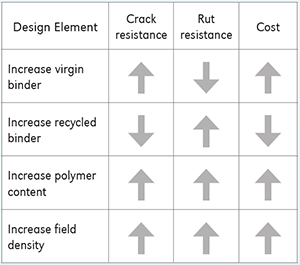
The materials selection process during the project development stage will have a significant impact on BMD results. Consider the elements in the chart below when combining different options available in designing and constructing an asphalt pavement:
Pavement distress design variables
Conclusion
The pavement material selection and mix design process are going to become more complex as research continues. More effort should be focused on maximizing pavement life in an effort to maximize taxpayer return on investment. Perpetual pavement design along with balanced mix design principles and thoughtful engineering analysis will afford us the opportunity to build more pavements to last, like U.S. Highway 10 in Minnesota.
Blow is an Asphalt Institute Senior Regional Engineer based in South Dakota.