 Mastercurves or: How I learned to stop worrying and love rheological analysis
[With apologies to Stanley Kubrick, and for those of you keeping score—this is my second “sixties” reference in the last two Lab Corner articles. You’d think I was a closet flower child or something.]
A mastercurve, with the associated shift factors used to construct it, can be used to fundamentally characterize the behavior of an asphalt binder in which time and temperature dependency are separated. It represents the response of an asphalt binder at a specific temperature across a wide range of frequencies or time. A mastercurve can help asphalt technologists understand the rheology of an asphalt material.
So how do we proceed with trying to build a mastercurve? In asphalt binder testing we use the dynamic shear rheometer (DSR) and test a sample at a range of temperatures and frequencies. It is generally recommended that testing is conducted at several temperatures surrounding the “Reference Temperature.” This is the temperature at which the mastercurve will be constructed.
At each test temperature, dynamic modulus testing is conducted at a range of frequencies. For practical testing purposes, frequencies less than 0.1 rad/s (0.0159 Hz) are often not used, nor are frequencies greater than 100 rad/s (15.9 Hz). Because data at lower and higher temperatures will be shifted to the reference temperature, some overlap in test data is preferred to produce a smooth mastercurve. Meaning? Test temperatures should probably not be more than 10°C apart.
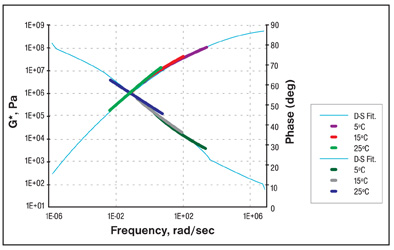
Once testing is completed, then the fun part (analysis) awaits. Fortunately computer programs, such as the RHEA™ software from Abatech, are available that simplify the job of constructing a mastercurve. The result looks something like Figure 1. Notice how the data at different temperatures and frequencies overlap to create a smooth, continuous curve.
In each mastercurve there are four characteristic parameters that provide a description of the rheology of the asphalt binder. The glassy modulus is a limiting modulus at very low temperatures (or high frequencies). For asphalt binders tested in shear, it is approximately 1 GPa (1000 MPa). On the other end of the curve is the steady-state viscosity which is the Newtonian viscosity at high temperatures (or low frequencies). The crossover frequency is the frequency (at the reference temperature) where the phase angle is 45 degrees. It can be considered as a hardness parameter at the reference temperature. Finally, the rheological index, R, is an indicator of the rheological type and indicates the amount of delayed elastic behavior that will be exhibited by the asphalt binder. It is analogous to the Penetration Index (PI).
Although we’ve just barely touched on the subject, time and space dictates that we pause for now with a promise to return to the topic at a later date for an examination of how we can use our rheological information. When we do visit the topic of mastercurves again, it will hopefully be with a less worried mind…not that there is an epidemic of worry about asphalt rheology.
Information provided in this article was derived from a peer-reviewed technical paper by Dr. Donald Christensen and Dr. David Anderson. For the detailed reference or to get a quote on performing asphalt binder testing, please contact either Mike Anderson (manderson@asphaltinstitute.org) or Gary Irvine (girvine@asphaltinstitute.org) of the Asphalt Institute Lab. For lingering feelings of worry about asphalt rheology…well, you’re on your own.
| Mike Anderson is the Director of Research and Laboratory Services at the Asphalt Institute. |


