


How Tennessee continues to be recognized for pavement performance

The seventh floor of the James K. Polk building houses the executive level of the Tennessee Department of Transportation in downtown Nashville. A visit to this floor enables one to see some of the rich history of the department, including pictures of major successful construction projects, department leaders and historical maps.
One of the most impressive features is the collection of obelisks that the department has won throughout the years, recognizing their perpetual pavement awards from the Asphalt Pavement Alliance (APA). There are 17 of them displayed throughout the level and, very clearly, there is a tremendous amount of pride in their display.
As TDOT continues to be recognized for these superior performing pavements, one must ask: How does it continue to identify and track so many pavements that meet the requirements? The answer is simple: TDOT’s Pavement Management System and their commitment to performance.
DOTs recognized for APA Perpetual Pavement Awards are presented an obelisk like the one shown here. To be recognized as a perpetual pavement, projects must meet the following requirements:
1. The pavement must be at least 35 years old
2. The pavement must have hot mix asphalt or warm mix asphalt binder and surface layers
3. The overall structural increase over the life is less than or equal to four inches
4. Resurfacing intervals of no less than 13 years on average
What is a pavement management system?
NCHRP Synthesis 501 titled, “Pavement Management Systems, Putting Data to Work”1 describes pavement management systems (PMS) as follows: “Pavement management systems are recognized as important tools to help transportation agencies optimize the use of available funding, better communicate funding needs, and more objectively manage their pavement network.”
These systems are required for managing the National Highway System under the MAP-21 and FAST acts. The objective of the synthesis was to document current pavement management practices in state and provincial transportation agencies to determine the extent that pavement management data are being used to support agency decisions. The synthesis references six minimum requirements for pavement management system capabilities and formal procedures2. The capabilities with some brief explanations are provided.
1. Collect, process, store and update pavement inventory and condition data.
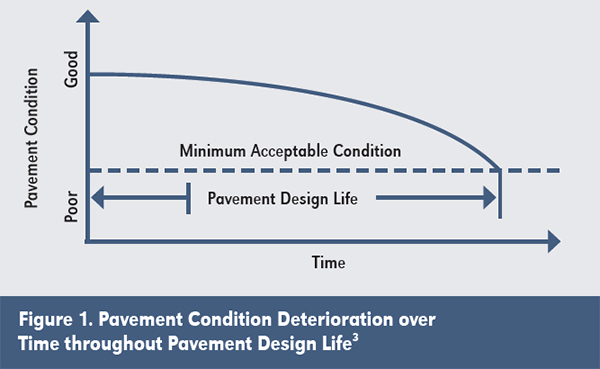
Each PMS enables agencies to maintain a catalog or database of its network. Typical data includes lane miles, pavement type, and traffic. Agencies collect measurement data, usually in the form of distress type and severity as well as smoothness data to assign a score or value to quantify the pavement’s condition. Over time as the pavement is subjected to traffic loadings and the environment, its score changes based on increased distress. Systems and processes are developed and implemented to enable the collection, review and updating of each pavement section’s condition over time. Ultimately, the data is compiled to determine the entire network’s overall condition. Figure 1 from FHWA3 is a visual tool that conveys the relationship between pavement condition and time over a pavement’s design life.
2. Predict changes in pavement condition over time.
A PMS can predict future pavement condition (or score) based on the rate at which the pavement section’s score is changing from year to year. The condition data over time provides insight to pavement engineers as to what future conditions might look like if the pavement does not undergo any treatment or rehabilitation. The data defines and shapes the curve like the example in Figure 1.
3. Evaluate the costs and benefits of alternative investment strategies.
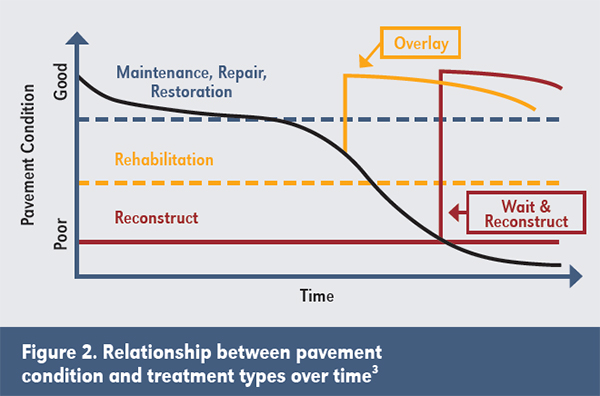
Marrying historical pavement condition data with historical construction records enables the agency to predict future conditions based on treatment types and their effectiveness. This is where concepts related to Life Cycle Cost Analysis are understood and applied. A treatment, whether it is a reconstruction, rehabilitation or preservation type treatment, resets the score and has a typical life expectancy (e.g., how long the pavement will maintain a certain score over time). Think of how people make decisions on vehicle maintenance costs. How frequently are oil changes performed? Should the standard oil be used, or should a synthetic oil be chosen for superior performance? What if there were no oil changes performed? An expensive engine repair may need to be completed sooner than expected if no maintenance is performed. Similarly, pavement condition data and future modeling enable an agency to predict cost-benefit scenarios for each pavement section based on future usage and current conditions. The figure below provided by FHWA3 shows how treatment timing and type are influenced by pavement condition.
4. Estimate short- and long-term budget needs.
An estimated cost based on the optimized recommended treatment type is assigned to each potential project.
All project costs are totaled to predict the overall budget needed to maintain a certain pavement network overall score. These budgets can also be narrowed down by district or functional class.
5. Determine optimal improvement programs.
The agency can establish project budget allocations based on PMS data. In this step, an agency may be able to identify and recommend a pavement preservation strategy to improve pavements earlier in their life to maintain higher scores and delay the timing of more intensive and expensive rehabilitation treatments. Other scenarios could include allocating funding to certain regions of the network based on needs and future performance targets.
6. Recommend strategies to manage pavements under constrained conditions.
The constrained conditions typically are future funds available to maintain the network. Agencies can compare current to future conditions based on funding available from the performance data and predictive models. Furthermore, agencies can set targets and strategies to objectively identify and fund projects to optimize the overall score of each pavement and ultimately, the entire network.
Moneyball for pavements
What happens when these functions are tied together? Think “Moneyball”, but for pavements.
“Moneyball: The Art of Winning an Unfair Game” authored by Michael Lewis and published in 2003 is a story about the Oakland Athletics baseball club and its general manager Billy Beane. The story describes how the team’s management shifted the mindset in assembling a winning baseball team by relying on analytical, statistics-based methodologies to generate a winning roster despite having a much smaller budget than competitors.
The story chronicles how the team would identify players through the draft or free agency that were undervalued through non-objective, traditionally based indicators. The result was a winning formula for the A’s that led to numerous playoff appearances but realized at much lower costs compared to their big-budget rivals, like the Red Sox or Yankees. Today, most major league baseball teams use the principles and statistics-based methodologies described in “Moneyball.” It has changed not only the way teams scout and evaluate players, but also how the game is played today.
How is this example like what a successful pavement management system provides? The system can understand each pavement section based on condition data and traffic volumes. The PMS can optimize which pavements segments and treatments are selected for optimal network performance. In some ways, the system looks at pavement segments similar to how the Oakland A’s would evaluate a player’s performance based on statistics and assign a predicted value for each player.
Consider, a high-cost home run-hitting slugger may not provide the same long-term overall benefit as two or three defensively sound, high batting average type players. This concept is like how an individual construction project would impact the pavement condition score for the entire network. A high-impact, high-cost reconstruction project (the home run hitter) may not have the same costs benefit to the overall network as multiple less invasive, more cost-efficient rehabilitation or preservation-type projects (the three high-percentage hitters). This changed mindset enables agencies to use data-driven decision-making to optimize overall performance rather than relying on “worst-first” or high-impact project selection.
TDOT’s pavement management system strategy
A deeper dive into how TDOT is utilizing its PMS reveals they are checking all the boxes. Mark Woods and Dr. Xiaoyang Jia provided insight as to how TDOT constructed the PMS and uses the data to help drive decision-making.
TDOT is responsible for maintaining approximately 1,200 centerline miles of interstate pavements and between 13 and 14 thousand miles of state route centerline miles. According to Jia, TDOT contracts with a third party to collect smoothness and distress data. Every interstate and National Highway System (NHS) route is evaluated and measured every year. The other pavement sections are measured every other year. The data collection process classifies all distress types in a semi-automated fashion. Digital images are used by computer algorithms to identify distress type and severity. The distress results are manually verified and a pavement score is assigned.
According to Woods, the most tedious and labor-intensive portion of building the PMS was uploading construction history data into the system. TDOT has a wealth of detailed construction records of its interstate, NHS and state route systems. Digitizing the plans and information into the PMS so that treatment types and timing can be accurately connected to pavement condition data required significant energy. This process has paid dividends, especially when it comes to identifying pavements that meet perpetual pavement award requirements.
Take State Route 50 in Maury County for example. State Route 50 is a connector that carries traffic from Interstate 65 to the city of Columbia in Middle Tennessee. This route has been recognized twice for perpetual pavement awards; first in 2016 for SR 50 from log mile (LM) 21.36 to 24.21 originally constructed in 1981 and second in 2021 for SR 50 LM 24.21 to 26.76 originally constructed in 1978. The comprehensive project history inventory enables the pavement engineering team to identify pavement sections that meet the minimum age requirements. Once these pavements are listed, TDOT’s pavement management system has a project history plot function that easily allows the pavement engineering team to track when resurfacing projects were completed and how much, if any, additional thickness was added to the pavement. The projects are then cross-checked with pavement condition data to ensure it has never reached a poor pavement condition or experienced any structural failures.
The narrative and history of the most recent SR 50 Perpetual Award winner is a resounding asphalt pavement success story. Historical records show that the gravel road treated with surface treatments and road mix in the 1950s and 60s was completely reconstructed in 1978 providing a modern connection between Columbia and Interstate 65. The pavement was not treated until 1996 after 18 years when a 1.25-inch overlay was applied to the surface. Another 17 years would pass before the top 0.8 inches of pavement surface were milled off and replaced in 2013. The third resurfacing occurred in 2021, when the top 1.25 inches of the pavement was milled and replaced after withstanding an increase of 20 percent in the average annual daily traffic since 2013. TDOT uses a 0-5 Pavement Quality Indicator (PQI) scale to quantify pavement condition with 5 representing pristine condition and 0 being the worst condition. Since the mid-1990s when TDOT started collecting such data, this pavement has never scored below 3.0.
Woods and Jia continue to focus on improving the project selection methodology. The goal is to create a better and more efficient resource for selecting all projects. A considerable amount of effort and resources are needed to keep the system viable and effective. For example, the duo continues to update prediction models. The update not only includes refreshing predictive models based on new data every year but also, system upgrades to include new treatments and their respective performance predictions. Preservation treatments like microsurfacing, for example, are an option in the system and are used regularly on the state network. Other rehabilitation-type treatments, like cold in-place recycling (CIR) and hot in-place recycling (HIR) that are relatively new to TDOT are also included in the analysis.
When the data and all treatment options are analyzed by the system, a treatment type and timing are recommended for each pavement section based on an overall cost-effectiveness calculation. The process then compiles the total effectiveness of all projects and ultimately prioritizes the compiled list to maximize the network condition and funding effectiveness.
Long-term pavement performance equals economic and environmental sustainability
How does all this information tie into and drive sustainability? Paraphrasing Woods, “Building sound pavements and keeping them that way is what sustainability is about. This means less rehabilitation and more preservation type projects to keep the pavements in better overall condition.”
Keeping treatment at or near the surface of the pavement requires less material removal and virgin material demand to rehabilitate. In other words, a sustainable future from both an economic and environmental perspective is to identify the right projects and treatments on the right roads based on data. Then, use the best materials and engineering design practices to ensure longevity and construct them per vetted specifications. That’s not to say that major reconstruction projects will go away. The remaining original interstate system pavements are reaching the end of functional life and are requiring complete reconstruction. In addition to that, many major pavements need to be constructed, reconstructed, widened or rerouted to meet current and future traffic and commerce needs. Data-driven decision-making and network optimization may reduce some of the major projects that cause significant user delays, drive higher costs and consume higher volumes of materials.
Be like Billy: Use data to drive decisions and optimize performance
Following core pavement management best practices is how an agency can be the Oakland A’s of pavement management. Applying those practices across an entire network can be challenging, especially when changing the mindset of how and why projects are selected. Increasing network conditions while being constrained by budgets and increasing costs is the desired and attainable goal. And that goal is pavement “Moneyball.”
Wielinski is an Asphalt Institute Regional Engineer based in Indiana.
References
1. NCHRP Synthesis 501; Pavement Management Systems Putting Data to Work, 2017
2. Notice of Proposed Rulemaking (NPRM); Federal Register (Vol. 80, No. 34, Feb 20, 2015)