 By Phillip Blankenship, Senior Research Engineer
Why do we want more density in a pavement? Density is the unit weight of a mixture. Density is usually shown as a percent of maximum theoretical (Gmm) or the specific gravity of the in-place compacted density divided by the Gmm. Air voids is used interchangeably with density and is calculated: percent air voids = 100 – percent density.
Density is achieved by compaction of the paver-laid asphalt-aggregate mixture. The squeezing together of the aggregates increases their surface-to-surface contact and inter-particle friction, resulting in higher stability and pavement strength.
The normal target in-place density on a “dense” hot-mix asphalt pavement is 92 to 93 percent of Gmm (or 7 to 8 percent air voids). If a pavement has low density (usually defined as less than 92 percent of Gmm), the air voids are interconnected and premature pavement distresses can result. These may be in the form of premature oxidation aging, increased cracking, rutting, structure weakening, raveling and stripping.
Optimally, a pavement is compacted as much as possible during construction. It is usually not possible for one to achieve the design density of 96 percent (4 percent air voids) by rolling due to lack of mixture confinement, cooling of the mat and mat thickness. So, we compact the mat as much as possible which many have found to be 92 to 93 percent of Gmm for the lift thicknesses we use today. Further compaction of the pavement is usually achieved over several summers by traffic until a pavement reaches its design density of 96 percent.
One of the concerns that the Kentucky Transportation Cabinet (KYTC) needed addressed is to better understand the relation of asphalt pavement density to pavement durability. Specifically, how does asphalt mixture density affect cracking and rutting? The Asphalt Institute worked with the Kentucky Transportation Center at the University of Kentucky and KYTC to investigate this. Various performance and performance-related tests such as the beam fatigue, dynamic modulus, and flow number were used to measure the effect of varying density.
Some state agencies have moved to more aggressive compaction specifications to increase pavement construction density from 92 percent of maximum theoretical (Gmm) density to 93 percent in pursuit of better hot mix performance. KYTC is considering doing the same.
While the increase in density of one percent seems simple, costs and benefits should be reviewed as with any specification change. An increase in density without recommending how to properly achieve this increase could result in a negative impact on pavement durability if the pavement is over rolled. The increase in density may require, in the simplest form, additional rolling or roller(s) resulting in an additional construction cost. The increase in density can also be achieved more easily by increasing lift thickness or lowering the design gyrations in the mixture design.
This article will focus on the potential performance only of increasing pavement density as it related to brittleness (fatigue) and rutting (flow number). How much of a performance difference will it make if KYTC increases target construction density?
Materials and Design
The Asphalt Institute used a laboratory standard mixture representative of Kentucky’s pavements. A 9.5mm nominal maximum aggregate size (NMAS) mixture that serves as KYTC’s surface layer was selected. A performance grade (PG) 64-22, a common grade of asphalt binder in Kentucky, was used for the laboratory standard binder. The job mix formula (JMF) was a SuperPave, KY Class 2 asphalt surface that is commonly placed on non-primary routes and is intended for traffic up to 3 million ESALs. The design was optimized at 5.4 percent asphalt binder for 96 percent (4 percent air voids) design density at 75 gyrations with a Gmm of 2.521.
The percent density of Gmm targets chosen in the test matrix represent densities that one may see if a pavement was under-compacted (88.5%) or compacted past the design potential (98.5%) which rarely, if ever, happens due to a mixture’s cooling and resistance to compaction. It should be noted that a tighter than normal tolerance of ±0.3% of Gmm was targeted to lessen experimental variability in this density study.
Sample Preparation
Seven sets of specimens representing the seven density levels were prepared for beam fatigue and dynamic modulus testing at 1.5 percent density increments with a tolerance of ±0.3 percent. The levels are: 2.5, 4.0, 5.5, 7.0, 8.5, 10 and 11.5 percent air voids. All samples were aged 4 hours in accordance with AASHTO R30, Mixture Conditioning of Hot-Mix Asphalt, Section 7.2 – Short-Term Conditioning for Mixture Mechanical Property Testing.
Fatigue (Brittleness) Testing
Beam fatigue samples were tested in a 4-point beam fatigue apparatus using constant strain at a 20°C test temperature. The strains varied per test from 300 to 800 microstrain to produce resulting cycles to failure (Nf) in the range of 10,000 to 1,000,000. The cycles to failure were calculated using the cycles x modulus numerical method. The function was then replotted to compare air voids to fatigue cycles. The trend was as expected. As the air voids decreased, the cycles to failure increased especially at lower test strains. This was true until the curve peaks at about 6.0 air voids.
The peak and lower cycles to failure at the four percent air void level is most likely due the crushed aggregates that were noted in the specimen preparation. If the mixture had been optimized to a lower air void level, the fatigue response may have continued to increase.
A decrease in air voids from 8.5 to 7.0 percent yield fatigue life increases of 4, 8, and 10 percent at 500, 450, and 350 microstrain.
The effect of air voids on the fatigue life of the asphalt mixture became more pronounced at lower strain levels. This may represent a pavement section with lesser load or deeper in the pavement cross section. Where improved density can have more long-term benefit.
The lack of response at the high strain may indicate that regardless of the air voids, high movements will quickly fail this mixture. This lack of response to high strain may be seen when overlaying a badly cracked pavement or concrete joint (high potential movements that result in cracking regardless of the HMA quality).
Flow Number (Rut) Testing
The Accelerated Mixture Performance Test (AMPT) Flow Number (FN) was also measured. AMPT Flow Number is an indicator of rutting. The higher the AMPT FN, the more rut resistant a mixture should be. For AMPT FN testing, a deviator stress of 600kPa (87psi) and a five percent initial contact stress of 30kPa (4.4psi) were used with no confining stress. All specimens were tested to five percent total strain. A test temperature of 56.9°C (134.4°F) was selected using LTPPBind 98 percent reliable pavement temperature at 20mm depth. This temperature is similar to the 50 percent reliable temperature at the pavement surface.
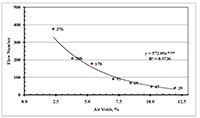
 A summary of AMPT Flow Number as a function of air voids is shown in FIGURE 2. The following conclusions can be made concerning modulus and the Flow Number testing:
As expected, the rutting resistance measured by the Flow Number increases as the air voids decrease (Figure 2). If just comparing the values at 8.5 percent to 7.0 percent air voids the Flow Number increases 34 percent from 68 to 91.
Cycles to five percent permanent strain also increase as air voids decrease with a similar fit as the Flow Number values. Summary During this project it was found that an increase in 1.5 percent density can increase the fatigue life by 4 to 10 percent and the Flow Number by 34 percent. While much of the information matches general expectations, this confirms that an increase in pavement density should have a positive effect on the overall pavement performance resulting in better durability and structure.
| ACKNOWLEDGEMENTS All funding for this work was from the Kentucky Transportation Cabinet (Allen Myers) in conjunction with the Federal Highway Administration. We also thank the Kentucky Transportation Center at the University of Kentucky for their assistance as the prime contractor for this project. |


