


The rest of the story
The objective of an asphalt mixture design is to determine the combination of asphalt binder and aggregate that will give long-lasting performance as part of the pavement structure. A desirable mix design uses a gradation of aggregates and binder content that yields a mixture having sufficient asphalt to ensure a durable pavement while maintaining sufficient mixture stability to satisfy the demands of traffic without distortion or displacement.
History of mix design methods
In the 1920s, Prevost Hubbard and Frederick Field of the Asphalt Institute developed a mix design procedure that utilized a minimum stability value that was based on experience with mixtures capable of resisting shoving in the pavement.
In the 1930s, two separate mix design methods were developed for asphalt mixture design. Francis Hveem, Materials and Research Engineer for the California Division of Highways developed a mix design procedure that introduced a kneading compactor. Hveem additionally added a mechanical test to measure the mixture’s ability to resist shear forces. The Marshall method, developed by Bruce Marshall of the Mississippi Highway Department, utilized the impact loading of a Marshall hammer to compact asphalt mixture specimens. Compacted specimens were then tested to determine the stability and flow parameters of the mixture. Both the Hveem and Marshall mix design methods were utilized for more than 50 years and are still being used in many parts of the world.
Fast forward to 1987, the Federal Highway Administration (FHWA) sponsored the $150 million Strategic Highway Research Program (SHRP). Its purpose was to develop performance-based technology and specifications that would result in significant improvements in the way highways were designed and built to address the demands on the highway infrastructure due to increasing traffic. One of the products of SHRP was a new mix design system known as Superpave™ (SUperior PERforming Asphalt PAVEments).
The Superpave system uses a gyratory compactor to prepare test specimens and uses mixture volumetrics to determine optimum binder content. Superpave also requires moisture resistance testing to verify the suitability of the designed mixture. The architects of Superpave intended to include performance tests to measure engineering properties that could be coupled with models to predict stress and strain and from which, damage could then be predicted. However, this effort fell short as these tests were deemed too expensive, too complicated, and not implementable. Most state agencies today have replaced Hveem and Marshall with the use of the Superpave (volumetric) mix design system including some type of moisture susceptibility testing.
Balanced mix design
In recent years there has been an increased use of Reclaimed Asphalt Pavement (RAP) and Recycled Asphalt Shingles (RAS) in asphalt paving mixtures. According to the National Asphalt Pavement Association (NAPA), the asphalt industry remains the country’s most diligent recycler with more than 95 percent of Reclaimed Asphalt Pavement (RAP) being put back to use in new pavements in 2021. The average percentage of RAP used in asphalt mixtures has increased from 15.6 percent in 2009 to nearly 22 percent in 2021. In 2021, the estimated RAP tonnage used in asphalt mixtures was 94.6 million tons. Asphalt mix producers continue to be motivated to use more recycled asphalt materials since the asphalt binder in the recycled materials can be used to replace a portion of the virgin asphalt binder – usually the most expensive component – in a mix. There is also a responsibility for manufacturers to operate in a more sustainable manner and asphalt mixture production is no exception.
One positive way to be more sustainable is to improve field performance of asphalt mixtures, extending the time required between subsequent overlays. However, there has been an increasing number of state agencies reporting premature cracking in relatively new pavements containing recycled asphalt binders. As a result, many highway agencies are actively working towards the implementation of a balanced mix design (BMD) procedure to improve the field cracking performance and durability of their pavements.
BMD is an asphalt mixture design process that uses performance tests on appropriately conditioned specimens to address primary modes of distress while taking into consideration asphalt mixture aging, traffic, climate, and location of the mixture within the pavement structure. Most BMD approaches use performance index tests to balance asphalt pavement rutting performance with durability/cracking performance. Typical index tests for rutting include Hamburg Wheel Track Test (HWTT), Asphalt Pavement Analyzer test (APA) or the High Temperature Indirect Tensile Strength test (HT IDT). The two most common cracking index tests are the Illinois Flexibility Index Test (FI or I-FIT) and the Indirect Tensile Cracking test (CT index). Implementation efforts are ongoing to develop a standard suite of index tests and standard criteria.
The rest of the story
Using the famous phrase from the great news broadcaster and radio personality Paul Harvey –
“And now… the rest of the story.”
The majority of tests being proposed for incorporation into a BMD approach are empirical index tests. A true mechanistic performance test measures the stress-strain response with time and temperature and the results can be coupled with a structural response model to predict actual performance. Empirical index tests are thought to be related to performance but a higher (or lower) test result does not guarantee better or worse field performance.
Rami Chkaiban at the University of Nevada, Reno developed six mixtures using similar materials from Nevada with similar index values and studied the influence of BMD on predictive pavement performance and pavement design, using FlexPAVETM. He found that mixtures with similar index results do not equal the same predictive performance. An example from this study reveals that Mix A-30-NV had a CT Index value of 128.1 while Mix B+-15-NV had a value of 123.6. It is generally believed that the higher the CT Index value, the better the crack resistance is. However, even though Mix A-30-NV has a slightly higher CT value, it was predicted to fail the cracking criteria at month 209 while Mix B+-15-NV passed and was not even close to approaching the failure criteria at 240 months.
Many pavement management systems provide agency personnel with a percentage of total cracking and don’t differentiate between the different cracking types. Knowing the type of cracking to be addressed is critical in choosing the most appropriate cracking text. FI and CT index testing each function differently and each relates to different types of cracking. Flexibility Index (FI) testing is intended to address bottom-up fatigue, top-down, and/or reflective cracking while the CT Index test is intended to address thermal and/or reflective cracking. Too often cracking is just grouped together, and cracking index tests are inappropriately used interchangeably.
Most BMD applications do not perform Long Term Oven Aging (LTOA) of the mix. A recent study done by Turner Fairbank Highway Research Center examined the appropriateness of thresholds established exclusively with short-term oven aging. The wide range of additives and reclaimed materials available to use in mixtures today can behave in drastically different ways between early, intermediate and late stages of service. The results also show a collapse in mixture cracking indices when LTOA is incorporated, raising concerns over BMD implementation using criteria established exclusively with short-term oven aging.
The selection of these index test specification threshold values for BMD is critical. Thresholds should be selected based on actual field performance. However, to do this can be a very long and difficult process for the agency. Instead, many agencies are using a benchmarking approach where mixes across the state or province are sampled and tested using whichever index tests they have chosen. Specification limits are often then selected based on the mean value (or some other percentile) of the test results for each of the tests and not based on field performance.
This can be seen when comparing the thresholds for CT Index for two neighboring states as shown in Table 1. Both of these agencies have recognized that these requirements may be a moving target and adjustments (changes) are likely as they learn more.
Table 1. CT Index Requirements for NY and PA
| State | CT Index Minimum Value Required |
| New York | 135 |
| Pennsylvania | 70-90 (based on traffic) |
The process for selection of the binder content for a BMD mixture needs to be clearly identified as there could be varying values chosen depending on who is making the selection. Figure 1 from Tom Bennert is an NJDOT 9.5mm mix that contains 15 percent RAP with a total design binder content based on volumetrics of 5.0 percent. However, when the NJDOT BMD process is employed that utilizes the Asphalt Pavement Analyzer (APA) for rutting and the Overlay Tester (OT) for cracking, this mix will require a minimum of 5.2 percent binder just to satisfy the OT cycles to failure criteria of 150. The maximum allowable binder content to still satisfy the APA rutting criteria of 7 mm will be 5.9 percent. The area of balanced performance for this mix will be 5.2 to 5.9 percent binder.
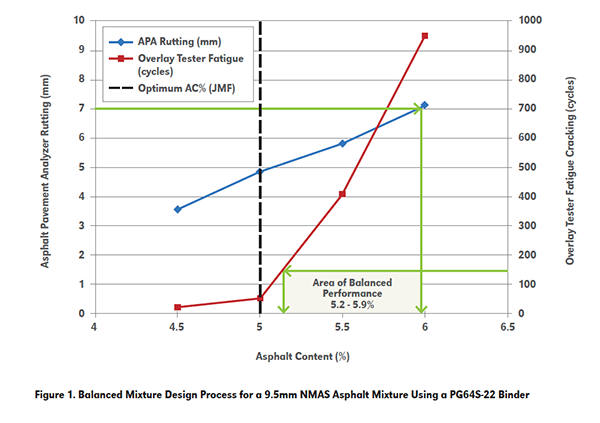
So, what binder content should be selected? If the mix producer selects the binder content, it will likely be around the lower end of the range (5.2 to 5.4 percent) – a decision that maximizes rut resistance and is the most economical to produce. But if the agency selects the binder content, it will likely be on the upper end of the range (5.7 to 5.9 percent) – a decision that maximizes durability. But if this mix is to be truly “balanced”, why not select the binder content at the midpoint of the range (5.5 to 5.6 percent)? But what happens if this range is very large?
In work done for NYSDOT, T. Bennert evaluated eleven NYSDOT-approved asphalt mixtures throughout the state of New York. Each of the mixtures was tested using three rutting index tests and three cracking index tests. These tests and the criteria selected by NYSDOT can be seen in the table below.
Table 2. Performance Test Criteria Used in
NYSDOT Balanced Mix Design Study
| Rutting Test and Criteria | Cracking Test and Criteria |
| Asphalt Pavement Analyzer < 4.0mm Rutting @ 8,000 cycles and 64oC | Overlay Tester > 250 cycles @ 93% Load Reduction and 25oC |
| Hamburg Wheel Tracking Test < 12.5mm Rutting @ 20,000 cycles and 50oC | SCB Flexibility Index > 8.0 @ 25oC |
| High Temperature IDT Strength > 30 psi @ 44oC | IDEAL-CT Index > 135 @ 25oC |
Each of the 11 asphalt mixtures that were evaluated for their minimum asphalt content, maximum asphalt content, and range of the BMD condition. The minimum asphalt content was based on the asphalt content to meet the average of the three cracking index tests, while the maximum asphalt content was based on the asphalt content to meet the average of the three rutting index tests. The range was calculated by simply subtracting the minimum asphalt content (based on the cracking index results) from the maximum asphalt content (based on rutting index results). Bennert determined that based on the tests and criteria that were used, five of the eleven mixtures are considered to be “balanced” and would not require any changes or adjustments to those mix designs. Six of the mixtures are considered to be “not balanced” and would require changes such as increased binder content. One mix in this study, based on volumetrics, called for 6.0 percent binder. The minimum binder content needed to satisfy the cracking index criteria was 6.39 percent. The aggregate structure was such that the rutting threshold was all the way up at 12.84 percent binder, resulting in a threshold range of 6.45 percent.If the midpoint of this range were to be used for binder content selection, this mix would adjust to 9.6 percent total binder. In cases like these, a process other than a simple average of thresholds may be more appropriate.
More work needed
When agencies are asked why they are considering the implementation of a BMD process, the most common response has been to improve the durability of their asphalt mixes. A less common response but nonetheless a consideration by some agencies is
that they want to use more recycled materials.
By and large, the agencies have expectations that by going to BMD their roads will get better. FHWA is also expecting improvements in durability as seen in their “Path Forward” mission statement:“The ‘Path Forward for Asphalt Pavement Performance’ will guide FHWA pavement and materials engineers in focusing their efforts to increase asphalt pavement performance by fostering science surrounding data-driven approaches to asphalt pavement across its life cycle in order to improve sustainability, including mobility, economy and safety. This ‘Path Forward’ will guide FHWA as we assist stakeholders in the implementation of BMD and performance testing tools to attain incremental improvements in mixture durability, cost-effective designs and innovation.”
Will all asphalt mixes become more durable when moving to BMD? Time will tell, but clearly agencies remain focused on implementing BMD in a manner that will see improved durability.
While the use of BMD has good intent, issues remain. Choosing the most appropriate tests and thresholds is critical. Long-term oven aging of mixtures should be considered when cracking index tests are employed, especially since additives and reclaimed materials used in mixtures can age in drastically different fashions. Thresholds need to be selected based on actual field performance and not on benchmarking. And lastly, a procedure for the selection of optimal binder content for any BMD approach needs to be clearly defined.
And now you know, the rest of the story – good day!
Harder is an Asphalt Institute Senior Regional Engineer based in New York.