 A systematic and objective way to measure
By Dr. Mark Buncher
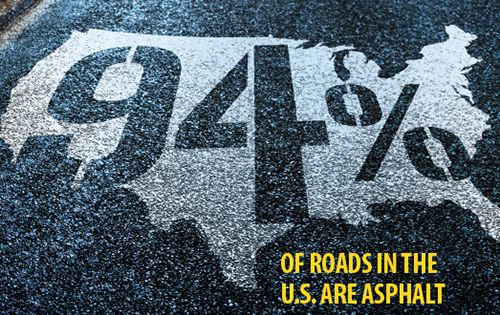
Since I started working in pavements some 30 years ago, I have repeatedly heard the claim by the asphalt industry that 93 (sometimes 94) percent of roads are paved with asphalt. I’m guessing you have heard the same.
Maybe it’s the engineer in me or maybe the fact that I’m from the “Show Me” state of Missouri, but I often wondered where that percentage came from. Could it be backed up? How was it calculated? Does the percentage vary year to year? What about state to state? Has the percentage been trending up or down over the years?
Or was the “94 percent asphalt” claim one of those folklore statements that when heard enough times from enough different sources, we believe it to be true without questioning its validity?
In the early 2000s, the asphalt pavement industry formed the national Asphalt Pavement Alliance (APA), with one of its stated goals being to protect and expand market share. Of course, with such a goal came the desire to somehow measure market share nationally in a systematic and objective manner. While a logical way to measure market share is in terms of tonnage, it was determined that tonnage information gets tracked differently and under different categories depending on the state. While some type of annual asphalt versus concrete tonnage analysis could be done for a particular state, there was no way to apply that same analysis consistently across all 50 states.
From this quest to track market share in some way came the analysis method described in this article, which tracks pavement type (asphalt versus concrete surface) across the federal highway system.
Data source and analysis
The data used in the analysis of pavement type is compiled from “Highway Statistics, Section IV: Highway Infrastructure”, published by the Federal Highway Administration (FHWA). This “Highway Statistics” report gets published annually and is an extensive database of highway inventory information submitted each year by each state’s transportation department. Current and past reports are available on FHWA’s website.
Table HM-51 of the “Highway Statistics” report compiles the number of centerline miles by pavement surface type for the different functional classes by state. It is important to note that the lengths reported are centerline miles, not lane miles. So, a six-lane urban interstate counts the same as a two-lane county road since the unit is centerline miles. Surface type is based on the most predominant surface type within a section. So, if four lanes are surfaced with asphalt and two lanes with concrete, that section would likely get recorded as asphalt. More information regarding the data reporting requirements of the state is provided in FHWA’s “Highway Performance Monitoring System (HPMS) Field Manual.”
Surface type can be reported as either bituminous (asphalt), concrete or unpaved. This analysis first calculates the total miles of paved surfaces (asphalt plus concrete) and then calculates the percentage of that total which is asphalt surfaced. This is done from the data in Table HM-51. The analysis does not reflect any unpaved surface, or asphalt surfaces that are less than 1” thick (such as bituminous surface treatments over gravel bases).
Table HM-51 reports this data by state for the following functional classes: interstates, other freeways and expressways, principal arterials, minor arterials and major collectors. Each of these classes are also broken down into a rural and urban component. The functional classes of minor collectors and local roads are not included in this analysis because surface type is not always designated.
2016 results
Because states report data from the previous year, and due to the lengthy collection and compilation process, there is an inherent two-year lag in reporting. For example, the “Highway Statistics” report published in 2018 shows data reflective of in-service conditions from 2016.
Using these 2016 totals across all 50 states from the most recent published report (2018), the chart illustrates the following:
• Shown in black, how the functional classes are categorized for this analysis.
• Shown in orange, total centerline miles (CM) in thousands (K), for each of the categories used in this analysis.
• Shown in blue, the percent of paved surfaces that are asphalt.
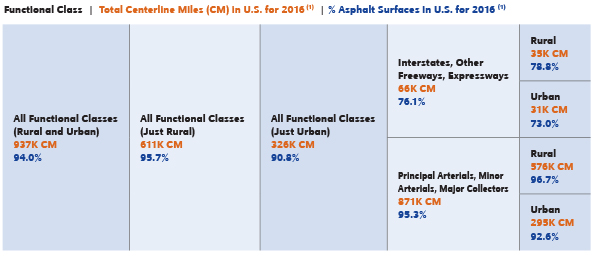
Note: Values calculated do not reflect unpaved surfaces or asphalt surfaces that are less than 1” thick.
The centerline mile totals shown in the chart put into perspective the relative size of each category. For instance, centerline miles of the combined interstate/freeway/expressway category (66K) are less than 10 percent of the centerline miles of the combined arterial and major collector category (871K). Regarding the percentage of roads that are asphalt surfaced, the percentage changes as the functional classes change. For all functional classes, rural and urban, the percentage is calculated to be 94.0% for the year 2016.
National trends
By utilizing the same systematic analysis for each year’s data, trends can be plotted from year to year. Doing so indicates that the national averages have not significantly changed over the years. For instance, the percentage of asphalt surfaces calculated each year for all functional classes (rural and urban) has only fluctuated from 92.9 percent to 94.0 percent over the past 20 years, with no apparent up or down trend. The same can be said when looking at trends for specific functional categories.
Comparing year to year numbers assumes the data collection and reporting approach by states didn’t change year to year. More than likely this assumption is not 100 percent true, as year-to-year fluctuations are more evident when analyzing a specific state versus the national average.
State-by-state analysis
Performing this analysis can be done with each state’s data, revealing states that historically have used more asphalt on their pavement surfaces and those that use more concrete. The chart on page 11 shows the percentage of asphalt surfaced roads by each state. There are 35 states above the national average of 94 percent asphalt surfaced, with several being at or very near 100 percent. To the contrary, there are six states currently falling below 90% asphalt: IA (61%), MA (76%), VA (81%), LA (85%) NE (88%) and WI (89%).
In conclusion, there is no perfect way to track market share on a consistent basis for all states. This method utilizes FHWA data in their annual “Highway Statistics” report. The advantages are that it is objective and consistent across all states. Another advantage is that results are not heavily affected by funding fluctuations, where a system based on tonnage would be. Disadvantages of this method are that the commercial (private) sector is not included, nor is asphalt less than 1” thick. In addition, the parameter “surface type” does not fluctuate as much year to year as a parameter based on tonnage.
So, the next time you hear a statement to the effect that 93 or 94 percent of our roads are asphalt, you will know the claim can be supported. And better yet, you can now make such a statement knowing it is true and can be measured. I know that makes me feel better.
Dr. Buncher is the Director of Engineering for the Asphalt Institute.
For a look at the state-by-state breakdown, click here.